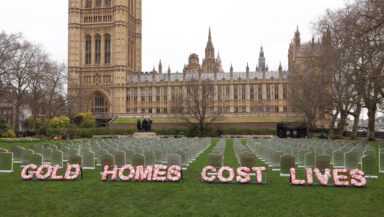
The UK government ranks worst out of top 5 Western European economies on green spending, new Greenpeace analysis can reveal. Out of the biggest 5 Western European economies, France, Germany, Spain, Italy, and the UK, the UK government spends the least in total, and also comes out worst when looking at per capita green energy spending.
The Greenpeace analysis, which examined the International Energy Agency (IEA) government energy spending tracker that looks at 2020-2023, also found that the UK ranks worst for total spend on low carbon and efficient transport out of those countries, despite the fact that transport is the UK’s largest emitting sector for greenhouse gas emissions.
Italy spends over three and half times as much as the UK on low carbon and energy efficient transport at 47.8 billion USD compared to the UK’s 13.1 billion, and Germany spends almost 3 times as much as the UK at 38.1 billion USD. The UK also comes out worst out of all 5 countries on fuels and technology innovation.
The UK ranks second to last out of the big 5 Western European economies on energy efficient buildings and industry. France spends almost double what the UK spends at nearly 28.5 billion USD, compared to the UK’s 14.6 billion. When broken down further to look at energy efficiency in the home, the UK spends 11.3 billion USD, again ranking it second to last out of the big 5 Western European economies, despite the UK having the worst housing in Europe for energy efficiency.
France has a very similar population size to the UK at 67.75 million, and 67.33 million in the UK, but it spends almost twice as much on green spending as a whole at 952.40 USD per capita, to the UK’s 494.43 USD per capita.
Greenpeace UK Climate Campaigner, Georgia Whitaker, said:
“It’s clear that despite the government’s bluster, we are utterly failing on the world stage when it comes to green investment. Not only are the US and China leaving us in the dust in the race on green technology, we’re also doing terribly compared to our European neighbours.
“Jeremy Hunt should use the Spring Budget to address this embarrassing failure, but instead he’s flirting with tax cuts that disproportionately benefit the wealthiest. Meanwhile, the rest of us struggle on with the cost of living.
“We urgently need a bold green industrial strategy to boost our flailing economy, help ordinary people with the cost of living, and tackle the climate crisis. Green infrastructure investment, with a focus on renewable energy, insulating our homes and making transport greener would do just that.”
Bob Ward, the policy and communications director at the Grantham Research Institute on Climate Change and the Environment at the London School of Economics and Political Science, said:
“There is now very clear evidence that the UK has been investing much less than its competitors across a range of areas, including on tackling climate change, biodiversity loss and environmental degradation.
“This low investment explains why productivity has stagnated in the UK and growth has been so feeble. It also explains why our homes and businesses are vulnerable to climate change impacts, our countryside and seas are becoming depleted of wildlife, our cities have dirty air, and our rivers and beaches are covered in sewage.”
ENDS
Notes to Editors
- Analysis is taken from the IEA’s Government Energy Spending Tracker.
- The tracker measures two types of energy spending: clean energy investment support and consumer energy affordability measures. For this analysis Greenpeace has removed Consumer energy affordability measures. This includes all measures intended to help consumers and enterprises weather high energy prices in light of the global energy crisis.
- However, the UK still spent the least both in total and per capita when including Consumer energy affordability measures.
- Spending is from between April 2020 to the end of April 2023.
- For analysis of the data Greenpeace has used the ‘Categories’ and ‘Measures’ categories provided by the IEA.
- Greenpeace’s full analysis including tables and graphs can be found here


